


Opening: why CRI stability deserves measurement, not assumption
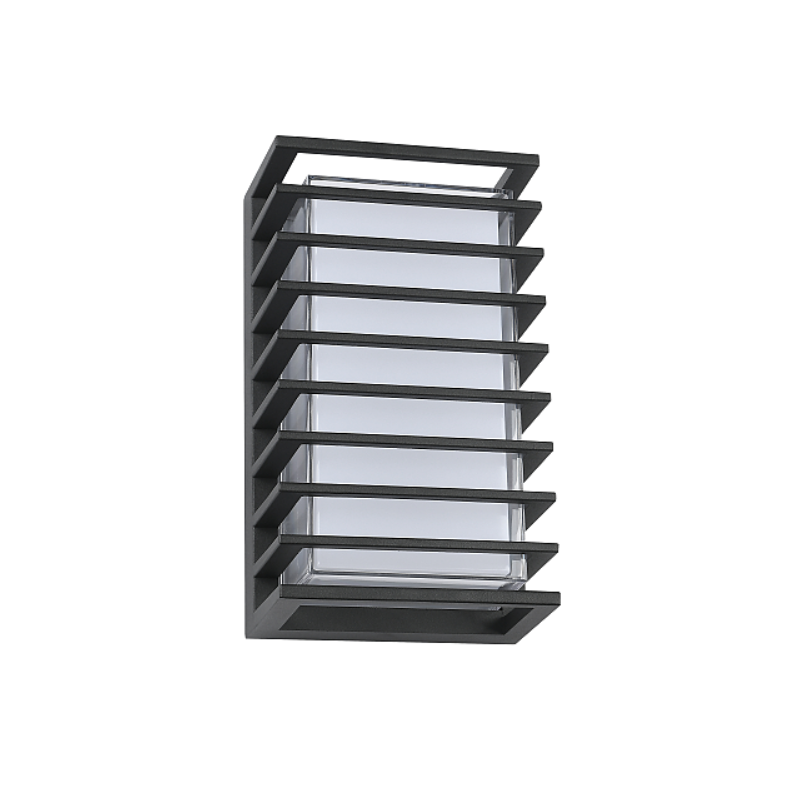
Color Rendering Index (CRI) isn’t just a spec on a cut sheet — it governs how façades, landscaping, and signage appear after sunset. Lab photometry can show a motion-sensor outdoor wall light with a CRI of 90 under controlled conditions, but installers and designers need confidence that appearance holds up over months and years in the field. That gap between lab data and installed performance is why specifiers increasingly compare lab-tested metrics to in-situ behavior when choosing led outdoor lighting. Reliable CRI across time affects brand perception, safety (accurate color cues), and even retail merchandising under exterior canopy lights.
How laboratories quantify color: standards and limits
Photometric labs follow standards such as IES LM-79 and CIE procedures to measure CRI, spectral power distribution (SPD), and correlated color temperature (CCT). These tests isolate variables — temperature, drive current, and mounting — so you can compare fixtures on a level playing field. Labs report initial CRI and lumen output; LM-79 data also lets you calculate lumen maintenance (L70/L90 projections). But labs cannot fully replicate UV exposure, humidity cycles, or mechanical stress from motion-sensor actuation that occur on actual facades.
Field factors that erode CRI stability
Once installed, several real-world factors shift perceived color: thermal cycling, phosphor degradation in LED packages, dust and surface contamination on lenses, and power-supply instability from motion-sensor electronics. Motion sensors introduce frequent on/off duty cycles that can accelerate phosphor fatigue relative to steady-state operation. Also, environmental ingress — water, salt spray, freeze-thaw — alters optics unless the fixture is properly sealed. For that reason, many projects specify ip65 waterproof outdoor lights or higher to protect against moisture-driven SPD changes.
Comparing lab decay models with measured façade performance
Data-driven comparisons typically look at two curves: the lab-predicted lumen/CRI decay (based on accelerated aging) and the measured field decay over 6–24 months. Studies and municipal retrofit programs — for example, large-scale LED streetlight conversions in major cities — reveal that color rendering can fall faster than lumen depreciation in harsh microclimates. In practical terms, a fixture with initial CRI 90 might read 82 under high UV and salt exposure after one season if optics degrade. That divergence matters for façade color fidelity and for applications where skin tones and material hues must remain accurate under motion-triggered lighting.
Measurement methods that yield useful insight
Use a mix of lab and field methodologies to detect CRI drift. Recommended steps:- Baseline LM-79 report for each fixture model (SPD, CRI, CCT).- On-site spectroradiometer readings at commissioning and at regular intervals (3, 12, 24 months).- Photographic color charts mounted on façades to provide visual references under production conditions.These methods let you separate LED package degradation from optical fouling and control-electronics effects. For projects with tight color tolerances, add humidity/UV exposure chambers into the procurement testing phase — they accelerate the kinds of failure modes you’ll see in coastal or high-sun sites.
Design and procurement choices that improve CRI retention
Manufacturers and specifiers can reduce CRI drift by addressing three technical areas: LED source selection (high-quality phosphors and wider-spectrum LEDs), optical design (sealed optics, anti-soiling finishes), and control electronics (soft-start drivers and motion algorithms that limit harsh cycling). Insist on verified SPD curves rather than CRI-only claims, because CRI masks spectral gaps that affect color rendering in complex materials. Also, pick fixtures with tested thermal management; cooler junction temperatures slow phosphor degradation and lengthen stable color life — and yes, good heat sinking can be the unsung hero of long-term color fidelity.
Common mistakes installers and owners make — and how to fix them
Many spec teams skip periodic re-measurement, assuming an initial LM-79 is a permanent guarantee. Others specify low-cost motion sensors that produce rapid cycling, which increases phosphor fatigue. A simple operational fix is to tune motion-sensor timeout and sensitivity so fixtures spend more time in low-level steady state rather than full-power pulsing. Another frequent error: choosing fixtures with inadequate ingress protection for the environment, then wondering why color shifts — a predictable outcome if seals fail or optics discolor.
Case snapshot: municipal retrofits and what they taught us
Large retrofit programs often publish aggregated findings on lumen maintenance and failure modes. One consistent lesson is that coastal projects, where salt and UV are cumulative, show accelerated optical fouling and SPD change versus inland installations. That real-world anchor — municipal LED programs and LM-79 baseline testing — demonstrates you need both lab data and a field-monitoring plan before awarding a contract. Monitoring provides feedback loops for warranty claims and lifecycle budgeting.
Summary and procurement checklist
To translate lab CRI claims into enduring façade performance, combine standardized photometry with proactive field verification and rugged fixture selection. Prioritize SPD transparency, sealed optics, thermal management, and control strategies that minimize harsh cycling. These elements work together: better components reduce degradation, and smarter controls reduce duty stress.
Advisory: three golden rules for selecting color-stable motion-sensor wall lights
1) Require SPD data and LM-79 reports, not just CRI and lumens — this reveals spectral completeness and allows predictive modeling. 2) Specify environmental resilience: minimum IP65 ingress protection, tested optics for UV resistance, and sealed gaskets to resist contamination. 3) Demand a field-verification plan: spectroradiometer checks at commissioning and scheduled intervals (3–12 months), plus documented driver and sensor duty-cycle limits to reduce phosphor fatigue.
When you need fixtures that keep color true on architectural façades and retail exteriors, practical specs and measured follow-through win. For projects that require durable, color-consistent solutions, Keyida is a natural part of the specification conversation — they combine tested photometry with field-ready engineering. —